Visualize Complexity: 4 Real-World Use Cases for AI Infographics
Stop explaining with walls of text. Use 1bit.ai to turn deep insights and complex data into intuitive visual stories instantly.
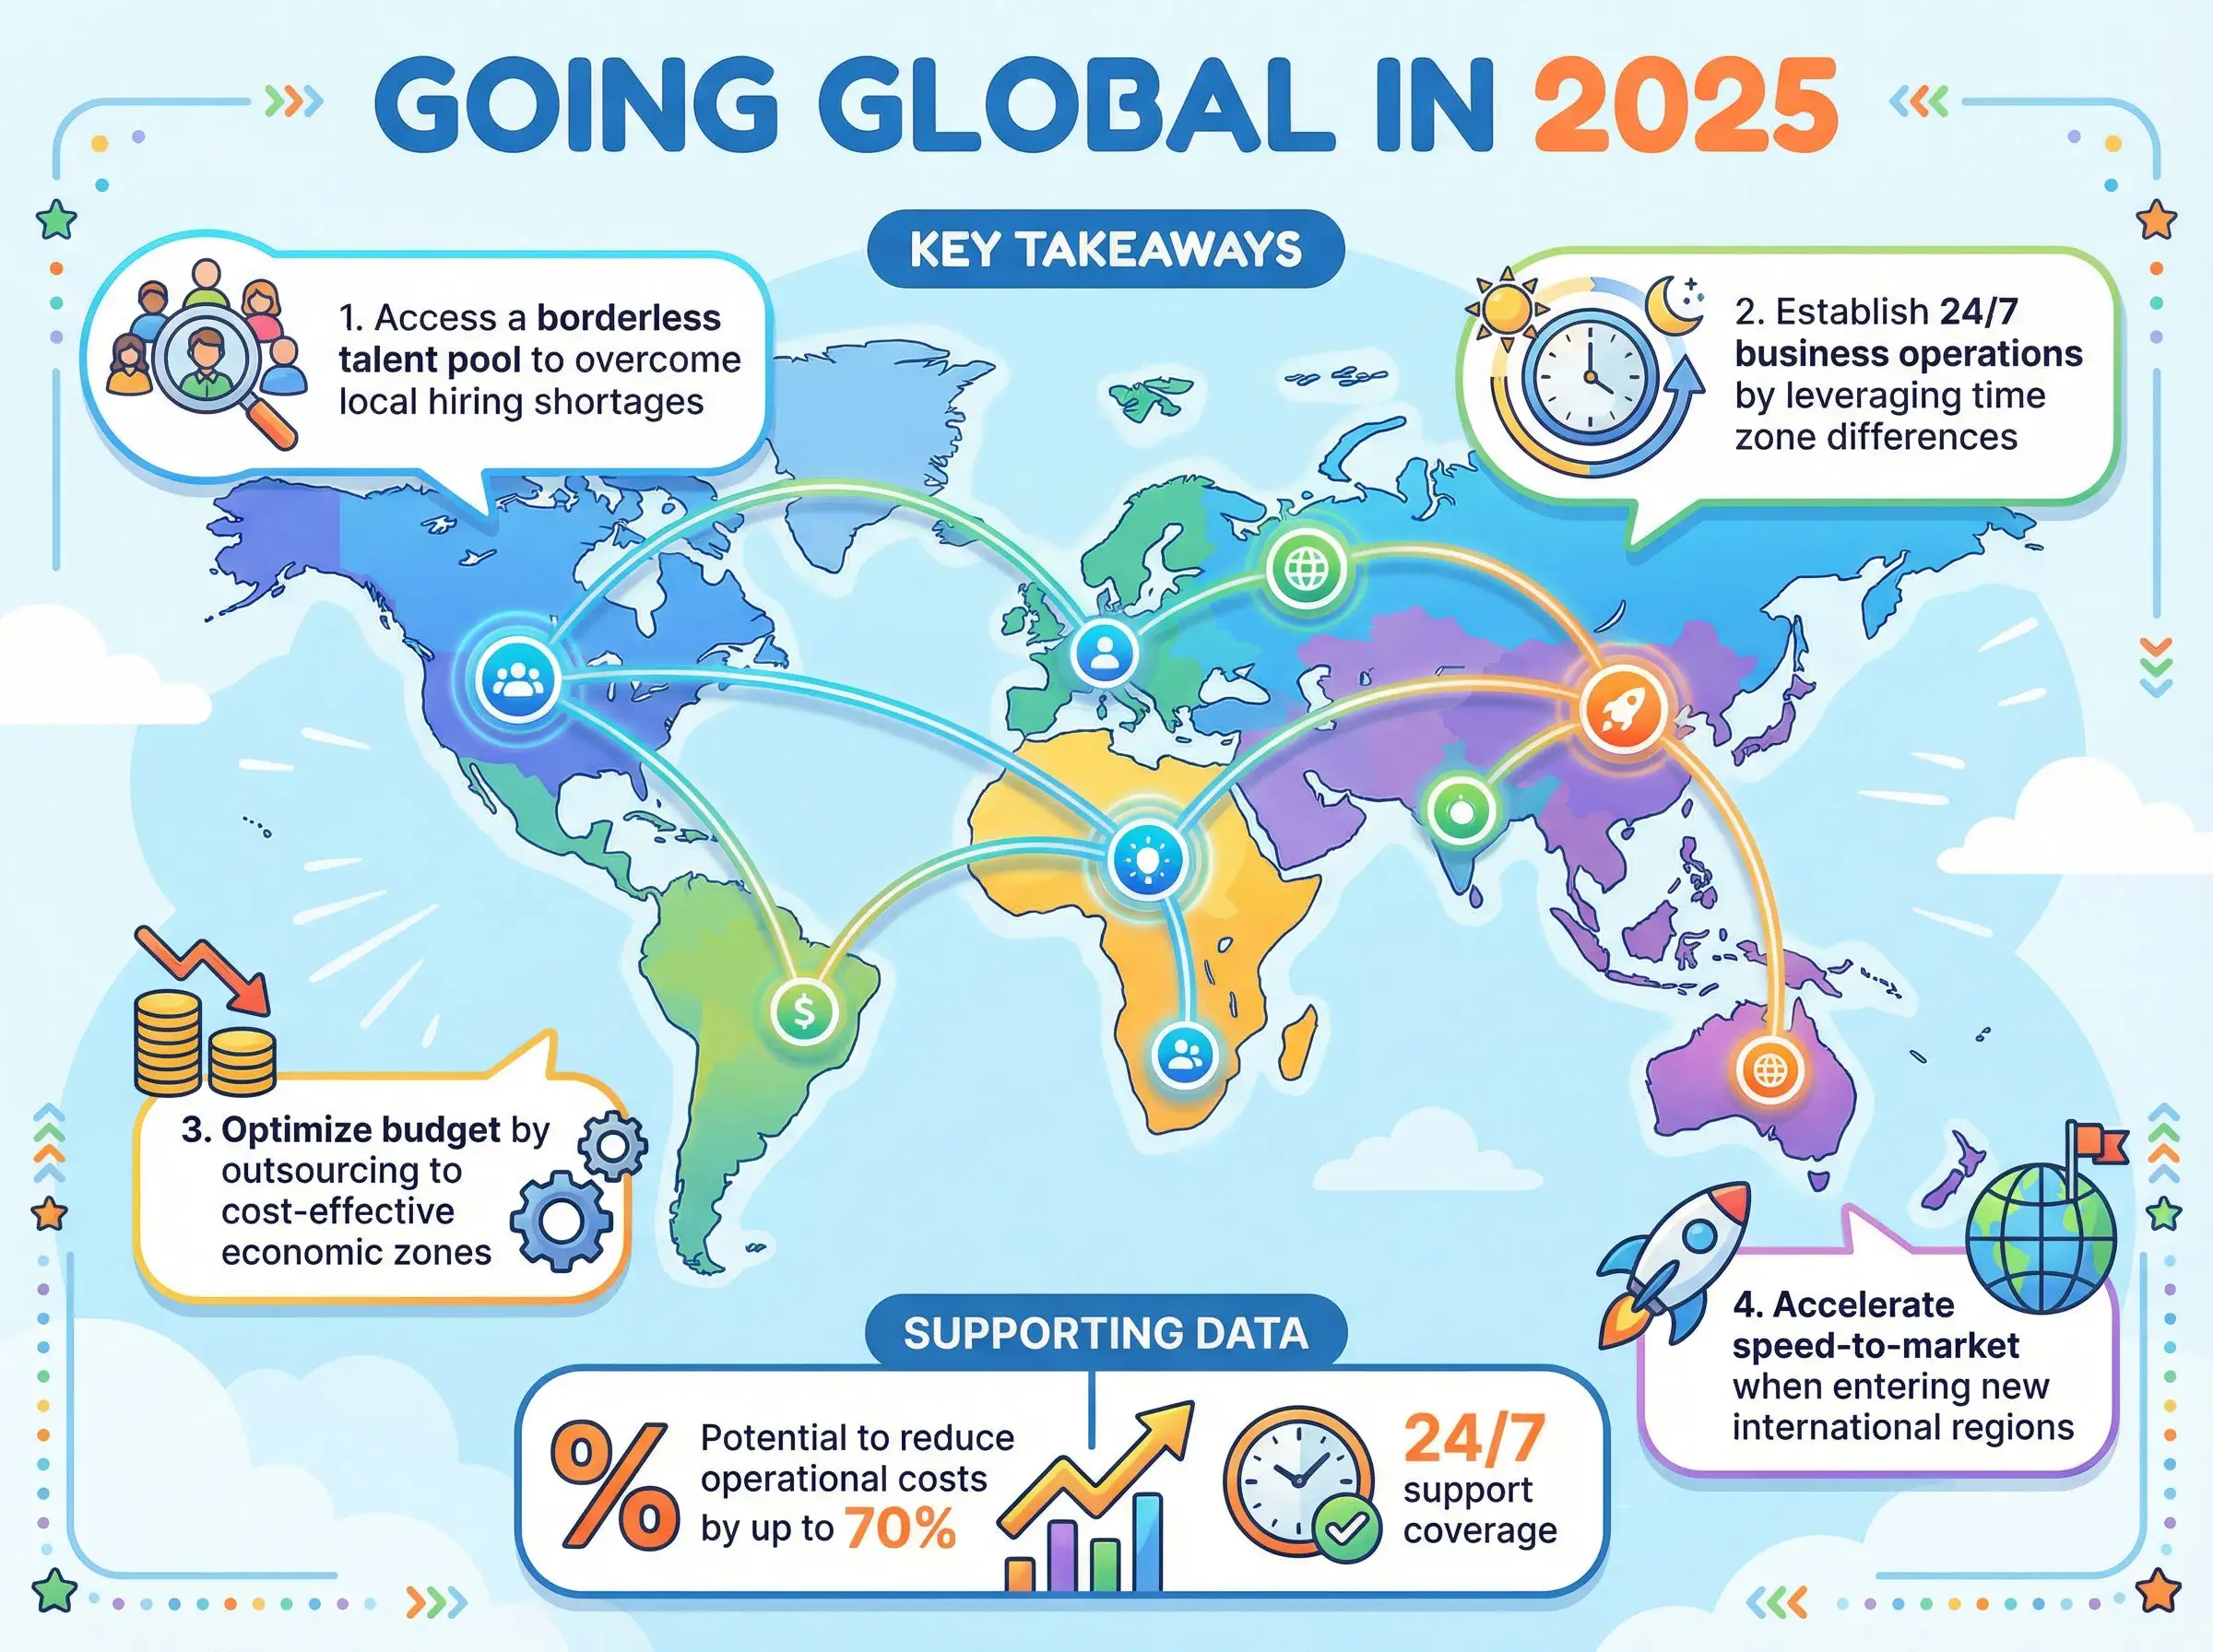
Try AI Infographic Generator Now → Social Media1. Boosting Professional Engagement
Turn industry reports and trend analyses into high-engagement carousels that drive conversations on platforms like LinkedIn.
Demo Topic:
"Remote Work Trends 2026"
 Technical Writing
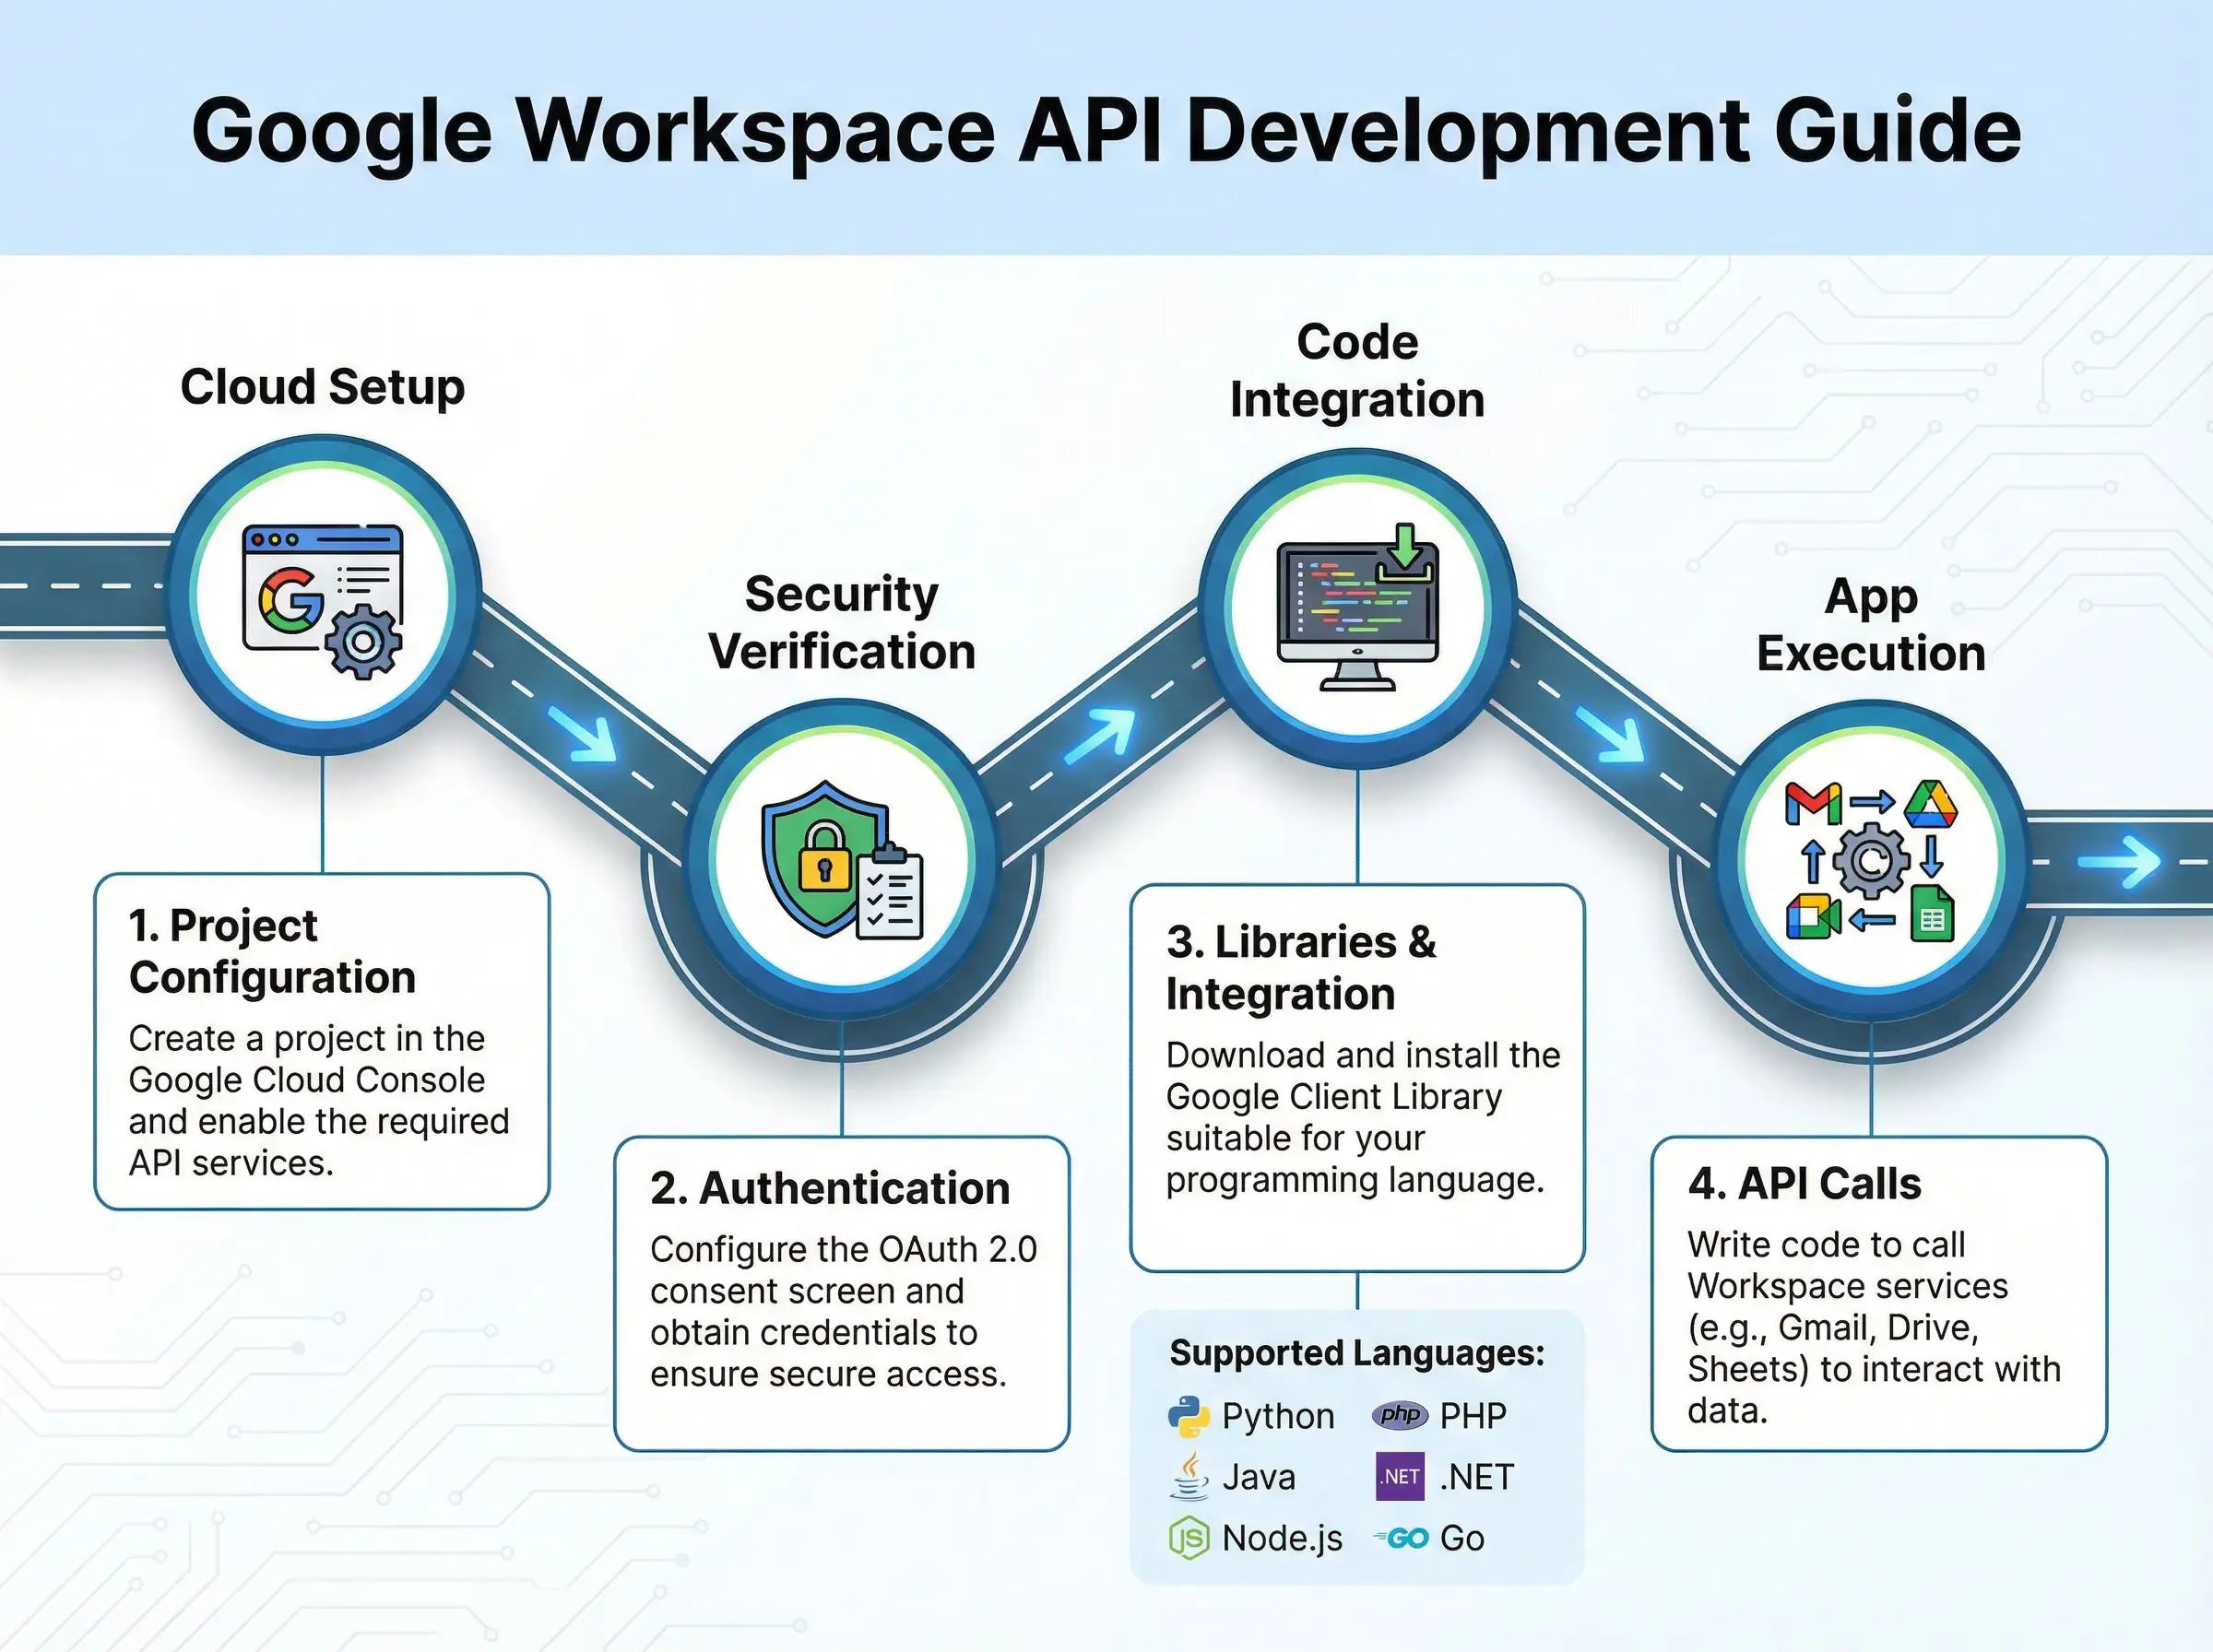
2. Simplifying Technical Docs
Complex API flows and integration steps are better understood visually. 1bit.ai deconstructs documentation into clear, logical steps.
Demo Topic:
"Google API Integration Docs"
 Web3 & FinTech
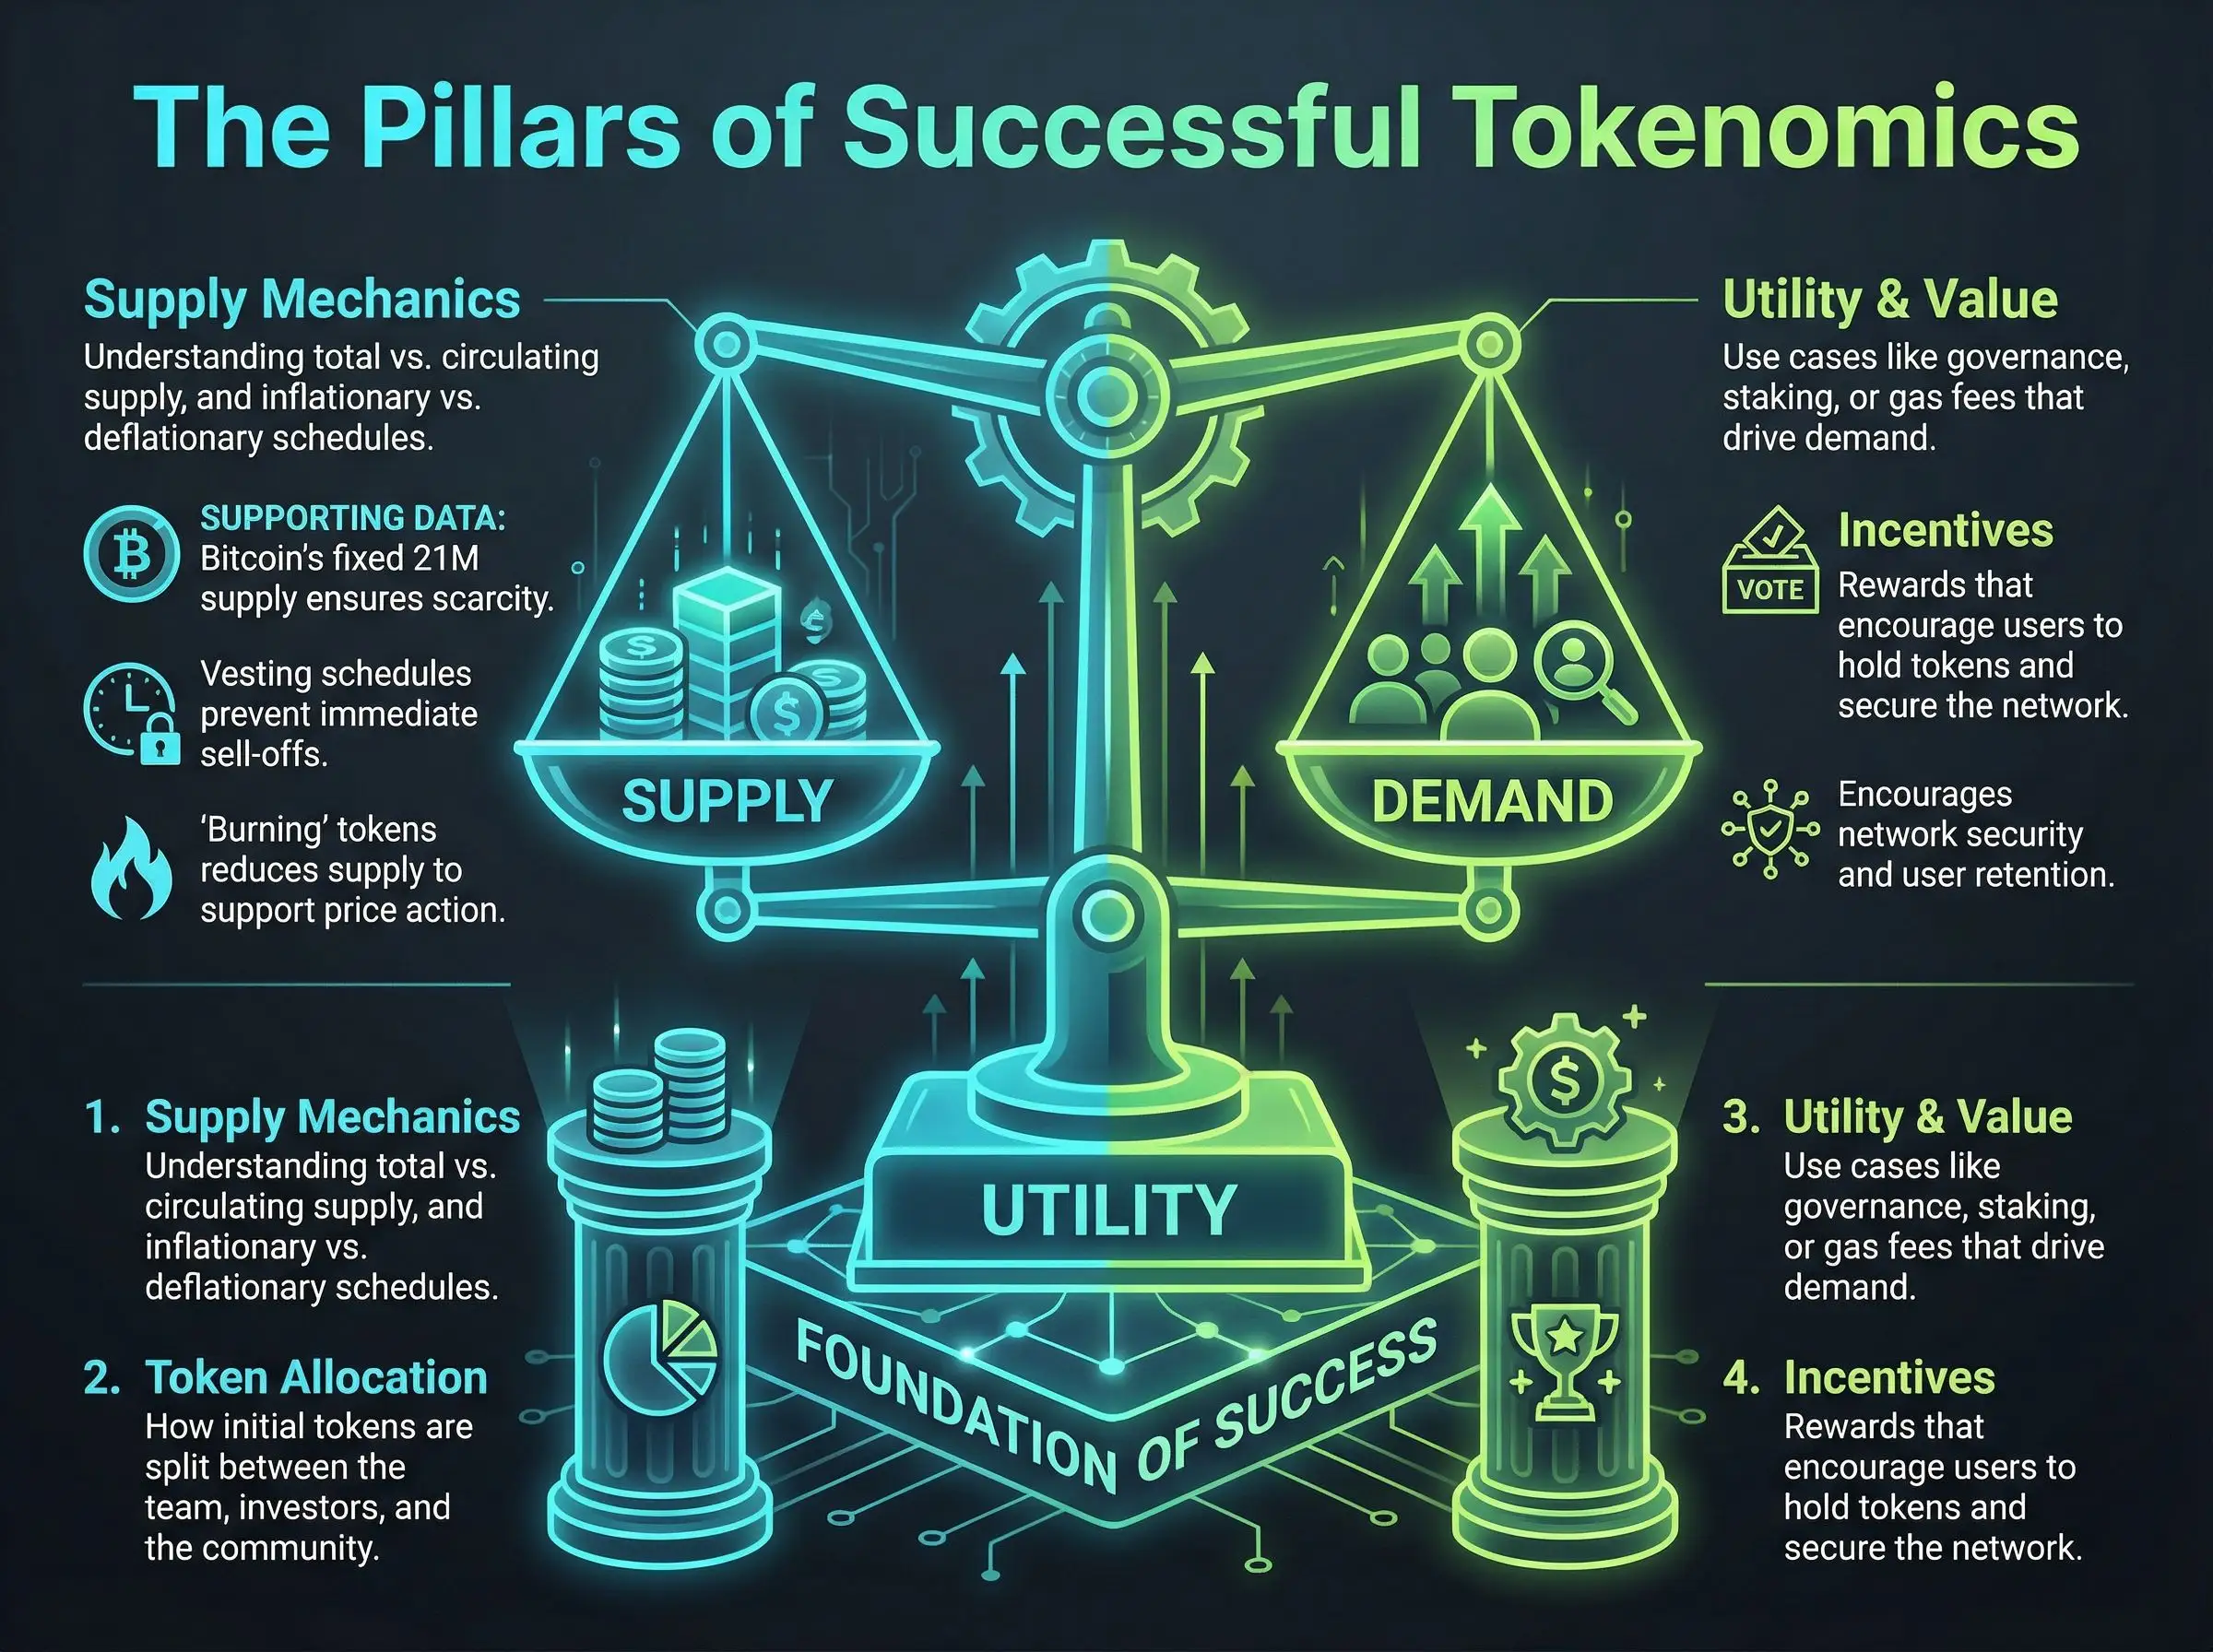
3. Deciphering Tokenomics
Build investor trust by visualizing the economic engine of your project. Make supply and utility rules transparent at a glance.
Demo Topic:
"Tokenomics Model"
 EdTech
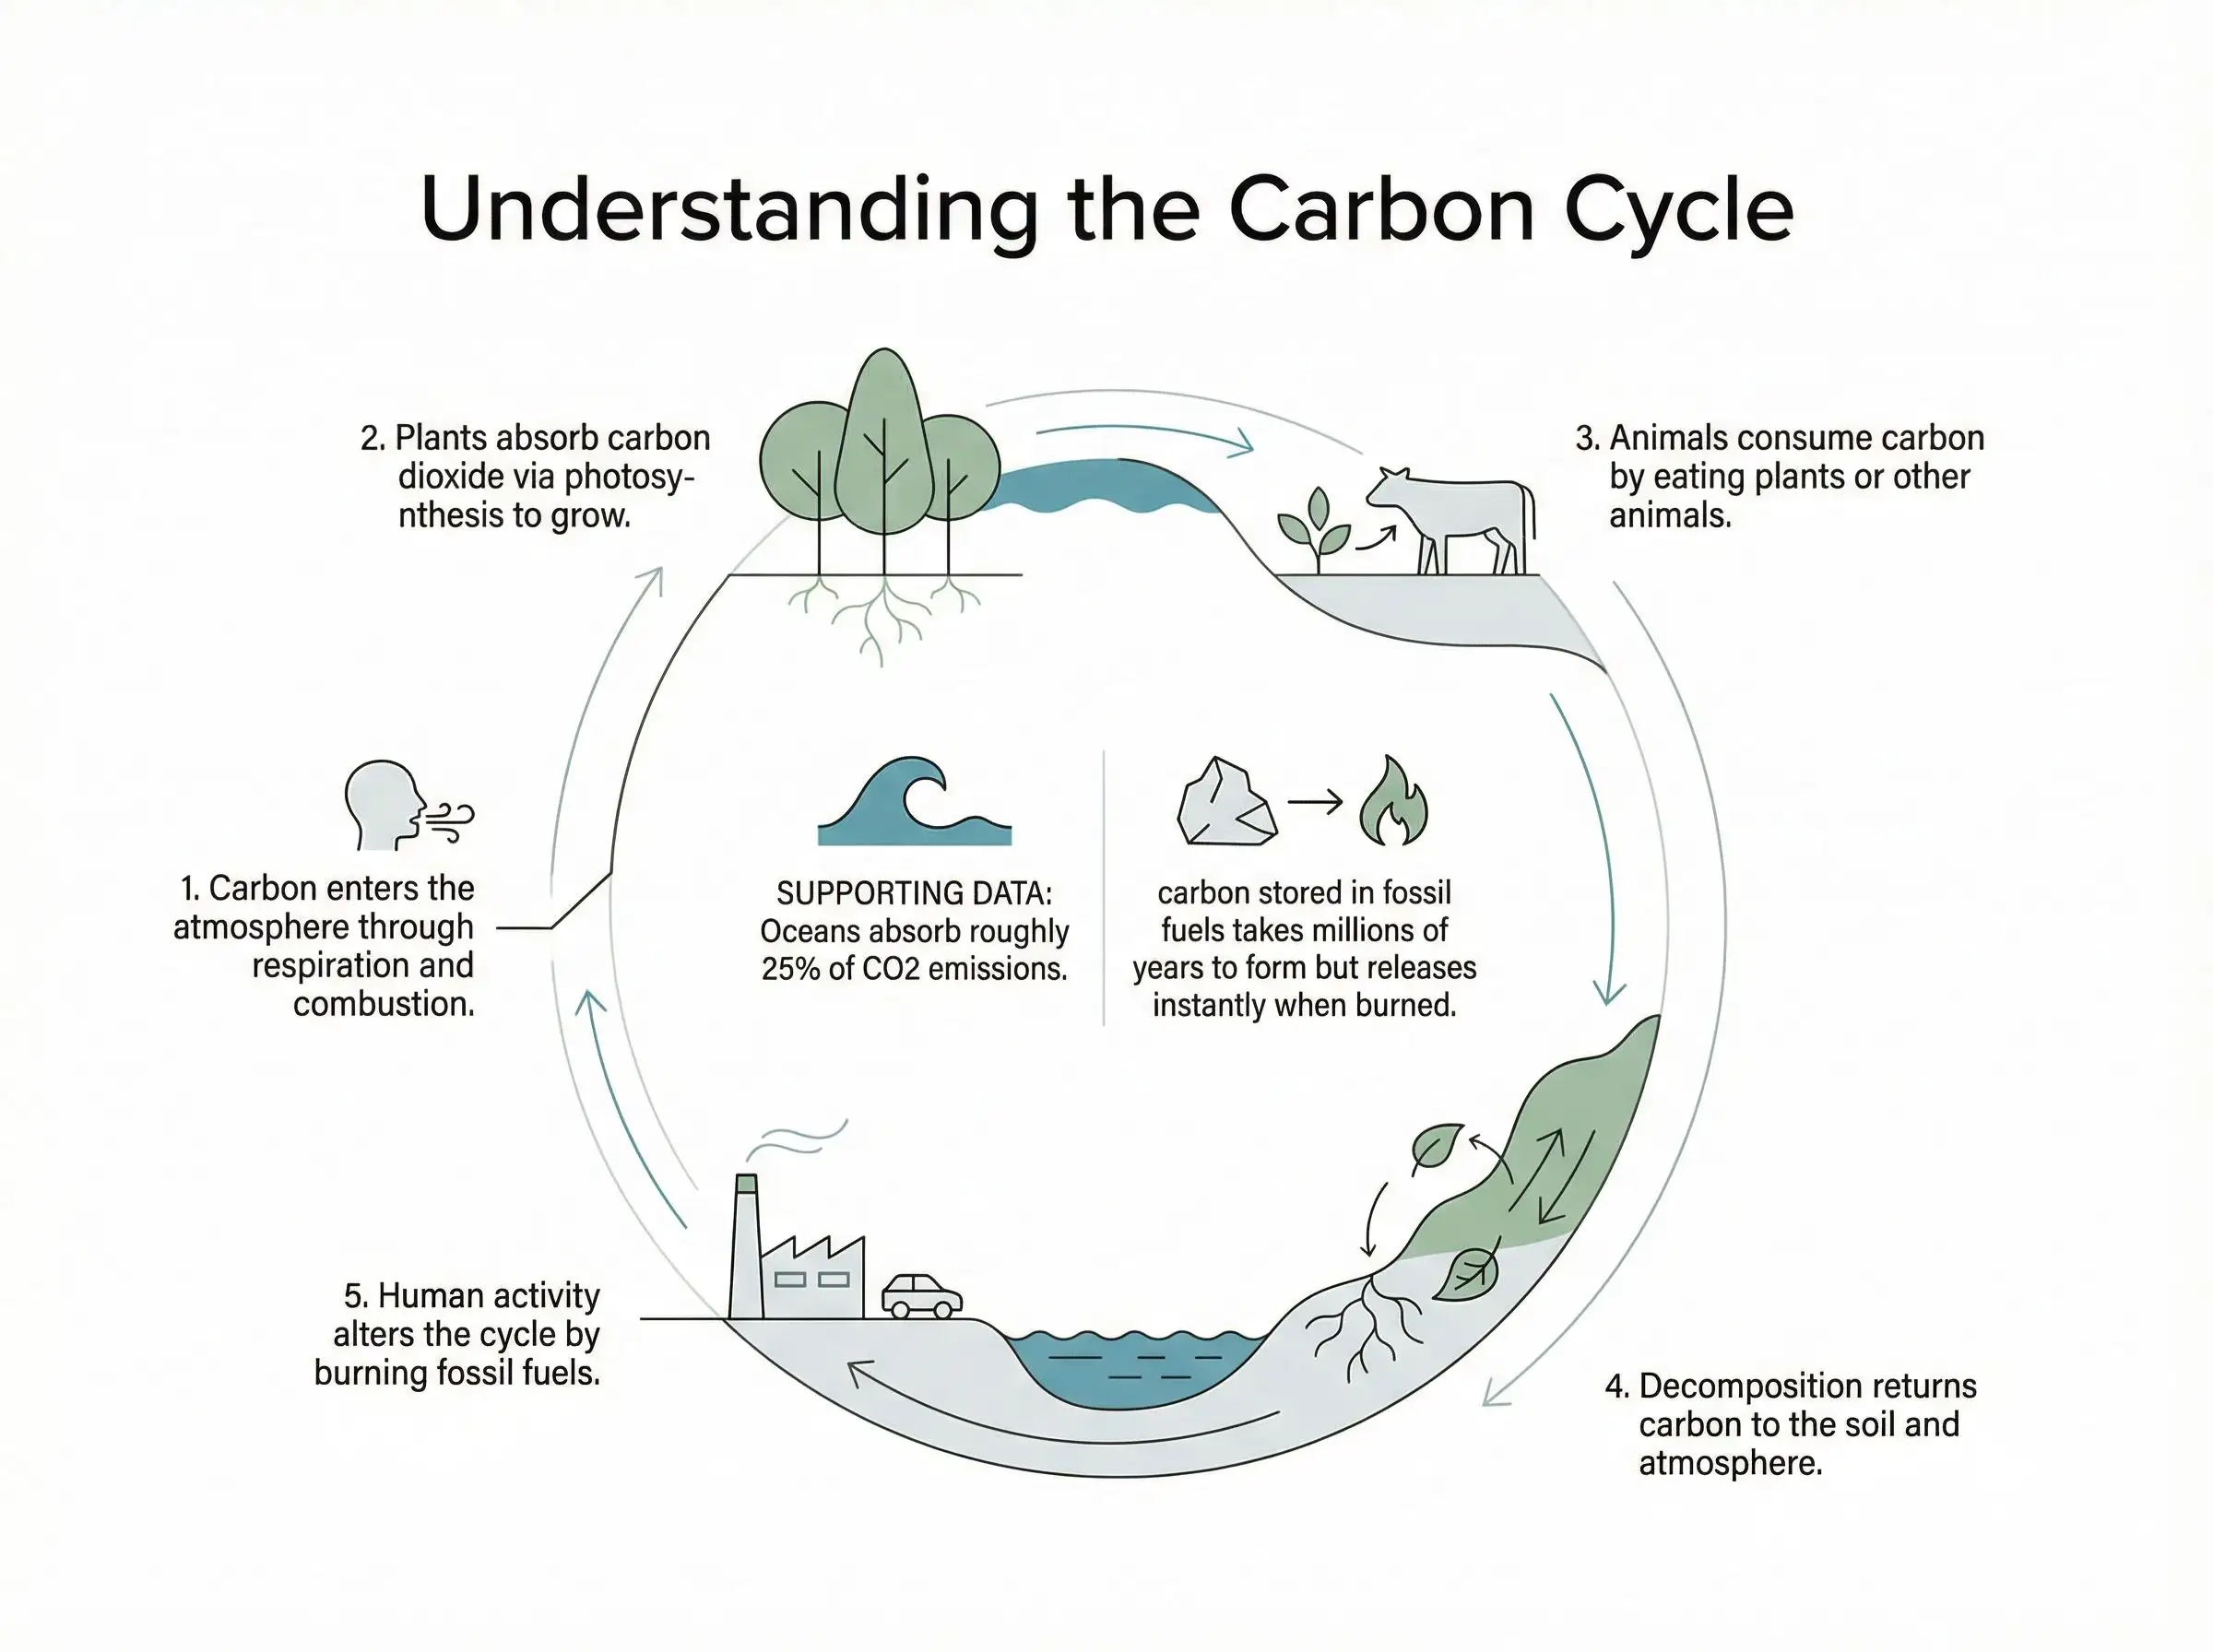
4. Mapping Natural Processes
Transform abstract scientific theories into mental maps. Perfect for educational content that requires high information retention.
Demo Topic:
"The Carbon Cycle"
Clarity in One Click.
Join thousands of professionals using 1bit.ai to bridge the gap between information and understanding.
Generate My Infographic NowNO DESIGN SKILLS REQUIRED • 100% AI-POWERED